New Mexico COVID-19 Data and Vaccination Map
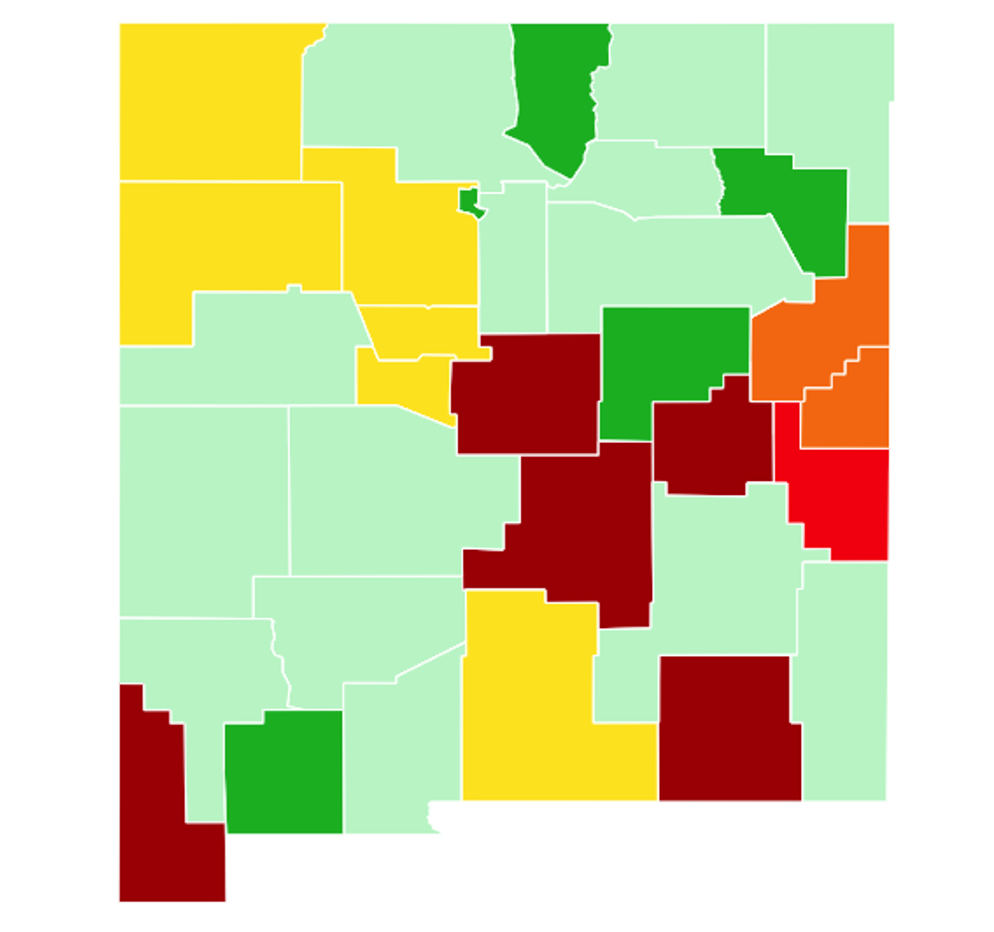
The New Mexico Dental Association collects and produces these maps weekly as a service to our members to update them on the latest COVID-19 data in their area. Each county will have the following information:Cases per 100K (last 7 days)
Daily Avg./100K (last 7 days)
New Cases (7 days)
Transmission Rate
Each county is also coded by color based on risk of encountering infectious patient
Green; Low risk
Light Green: Slight risk
Yellow: Moderate risk
Orange: Increased risk
Red: Very high risk
Maroon: Extreme risk
NOTE: THESE COLORS DO NOT CORRESPOND WITH THE GOVERNORS "RED-YELLOW-GREEN" GATING SYSTEM. That is a separate evaluation system. Our colors correspond with infectious patient risk.
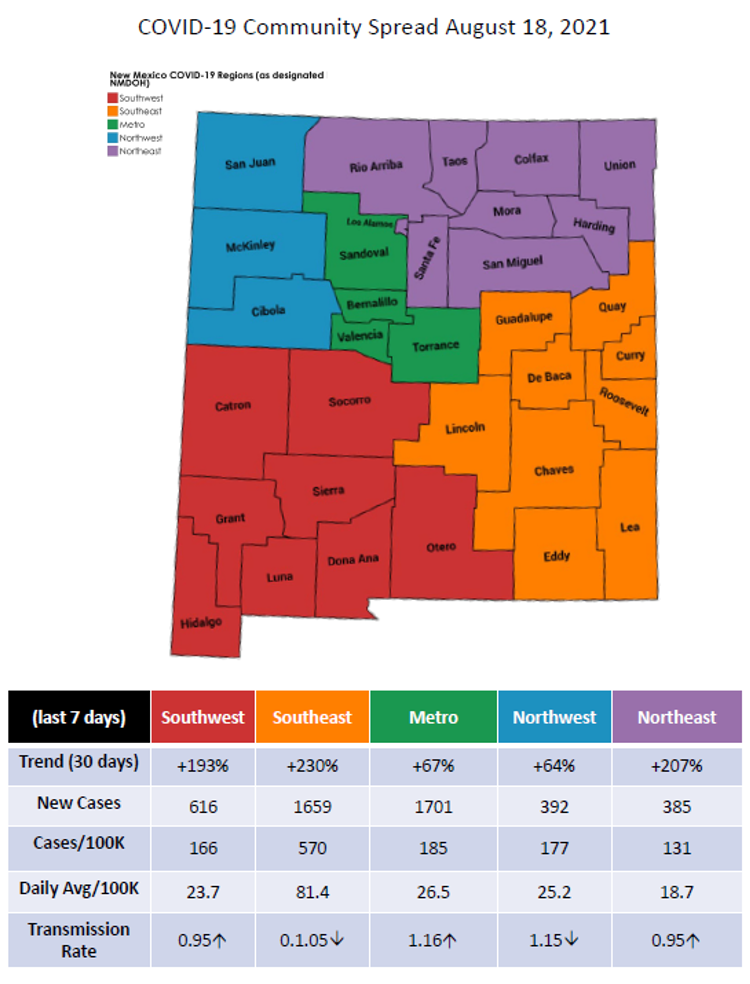
You will also find a second map showing regions as designated by the Department of Health. The table below the map indicates data by region and trends since previous week.
We have added an additional map of vaccinations by county, giving the total percentage of people vaccinated, the total number vaccinated as well as the population for each county.
Data reported by the New Mexico Department of Health and the New York Times.
Reporting date: August 18, 2021
PREVIOUS COVID MAP August 4, 2021
CLICK HERE to see the county statistics. . 


